Monitoring and Reporting
Operaide records operational data on two distinct layers: an always-on stream of usage metrics that captures every workflow execution and every AI call as it happens, and an optional detail trace that records per-step inputs and outputs when you enable debug mode for a specific deployment. The Reporting dashboard surfaces the always-on stream. This chapter explains both layers, when each is appropriate, and how to manage them.
The Two Recording Layers
Always-on usage metrics
For every workflow execution, Operaide automatically records a ReaktorUsage entry containing:
- The reaktor (id and name) and the package (app id) it belongs to
- A unique run id
- The start time, end time, and the duration in milliseconds
- The execution status (
successorerror), with the error message when the run failed - The user who triggered the execution
- The organization context
For every AI call inside a workflow, Operaide additionally records a TokenUsage entry containing:
- The model and the provider that handled the call
- Input, output, and total token counts
- The reaktor and the run id the call belongs to
- The user who triggered the call
- The organization context
These records are written unconditionally. There is no setting to turn them off, and debug mode is not required. They are stored in the platform's own database with no automatic expiry — they remain available for as long as the operator wants to keep them.
What is not captured at this layer: the prompts sent to the model, the model's responses, the inputs and outputs of individual aktor steps, and any intermediate values inside the workflow. Those only exist when you explicitly enable detail traces — see the next subsection.
The split is intentional. The always-on stream is small enough to keep persistently and rich enough to answer billing, capacity-planning, and "is the system healthy" questions. The detail trace is large, contains potentially sensitive content, and is meant for troubleshooting — not as a permanent archive.
Opt-in detail traces
When you enable debug mode for a specific deployment, Operaide additionally writes per-step traces into the AktorStore collection. Each trace records the inputs and outputs of every aktor in the workflow execution, including the prompts sent to AI models and the responses received. Detail traces are valuable for diagnosing a misbehaving workflow or understanding why a particular run produced a particular result.
Two limits apply to detail traces today:
- Retention is fixed at 30 days. A MongoDB TTL index automatically removes traces older than 30 days. There is no per-deployment configuration for this retention period yet.
- Credentials are automatically redacted before storage, so an API key that appears in an aktor input does not end up in plain text in the trace. Personal data, business content, and other sensitive values are not redacted automatically — only credential-shaped values are caught. See Security and Privacy → Audit Logging and Usage Tracking for the redaction details.
Detail traces are designed for time-boxed investigations, not for permanent storage. If your compliance regime requires long-term retention of execution detail, see Long-term Retention at the end of this chapter.
How to Access
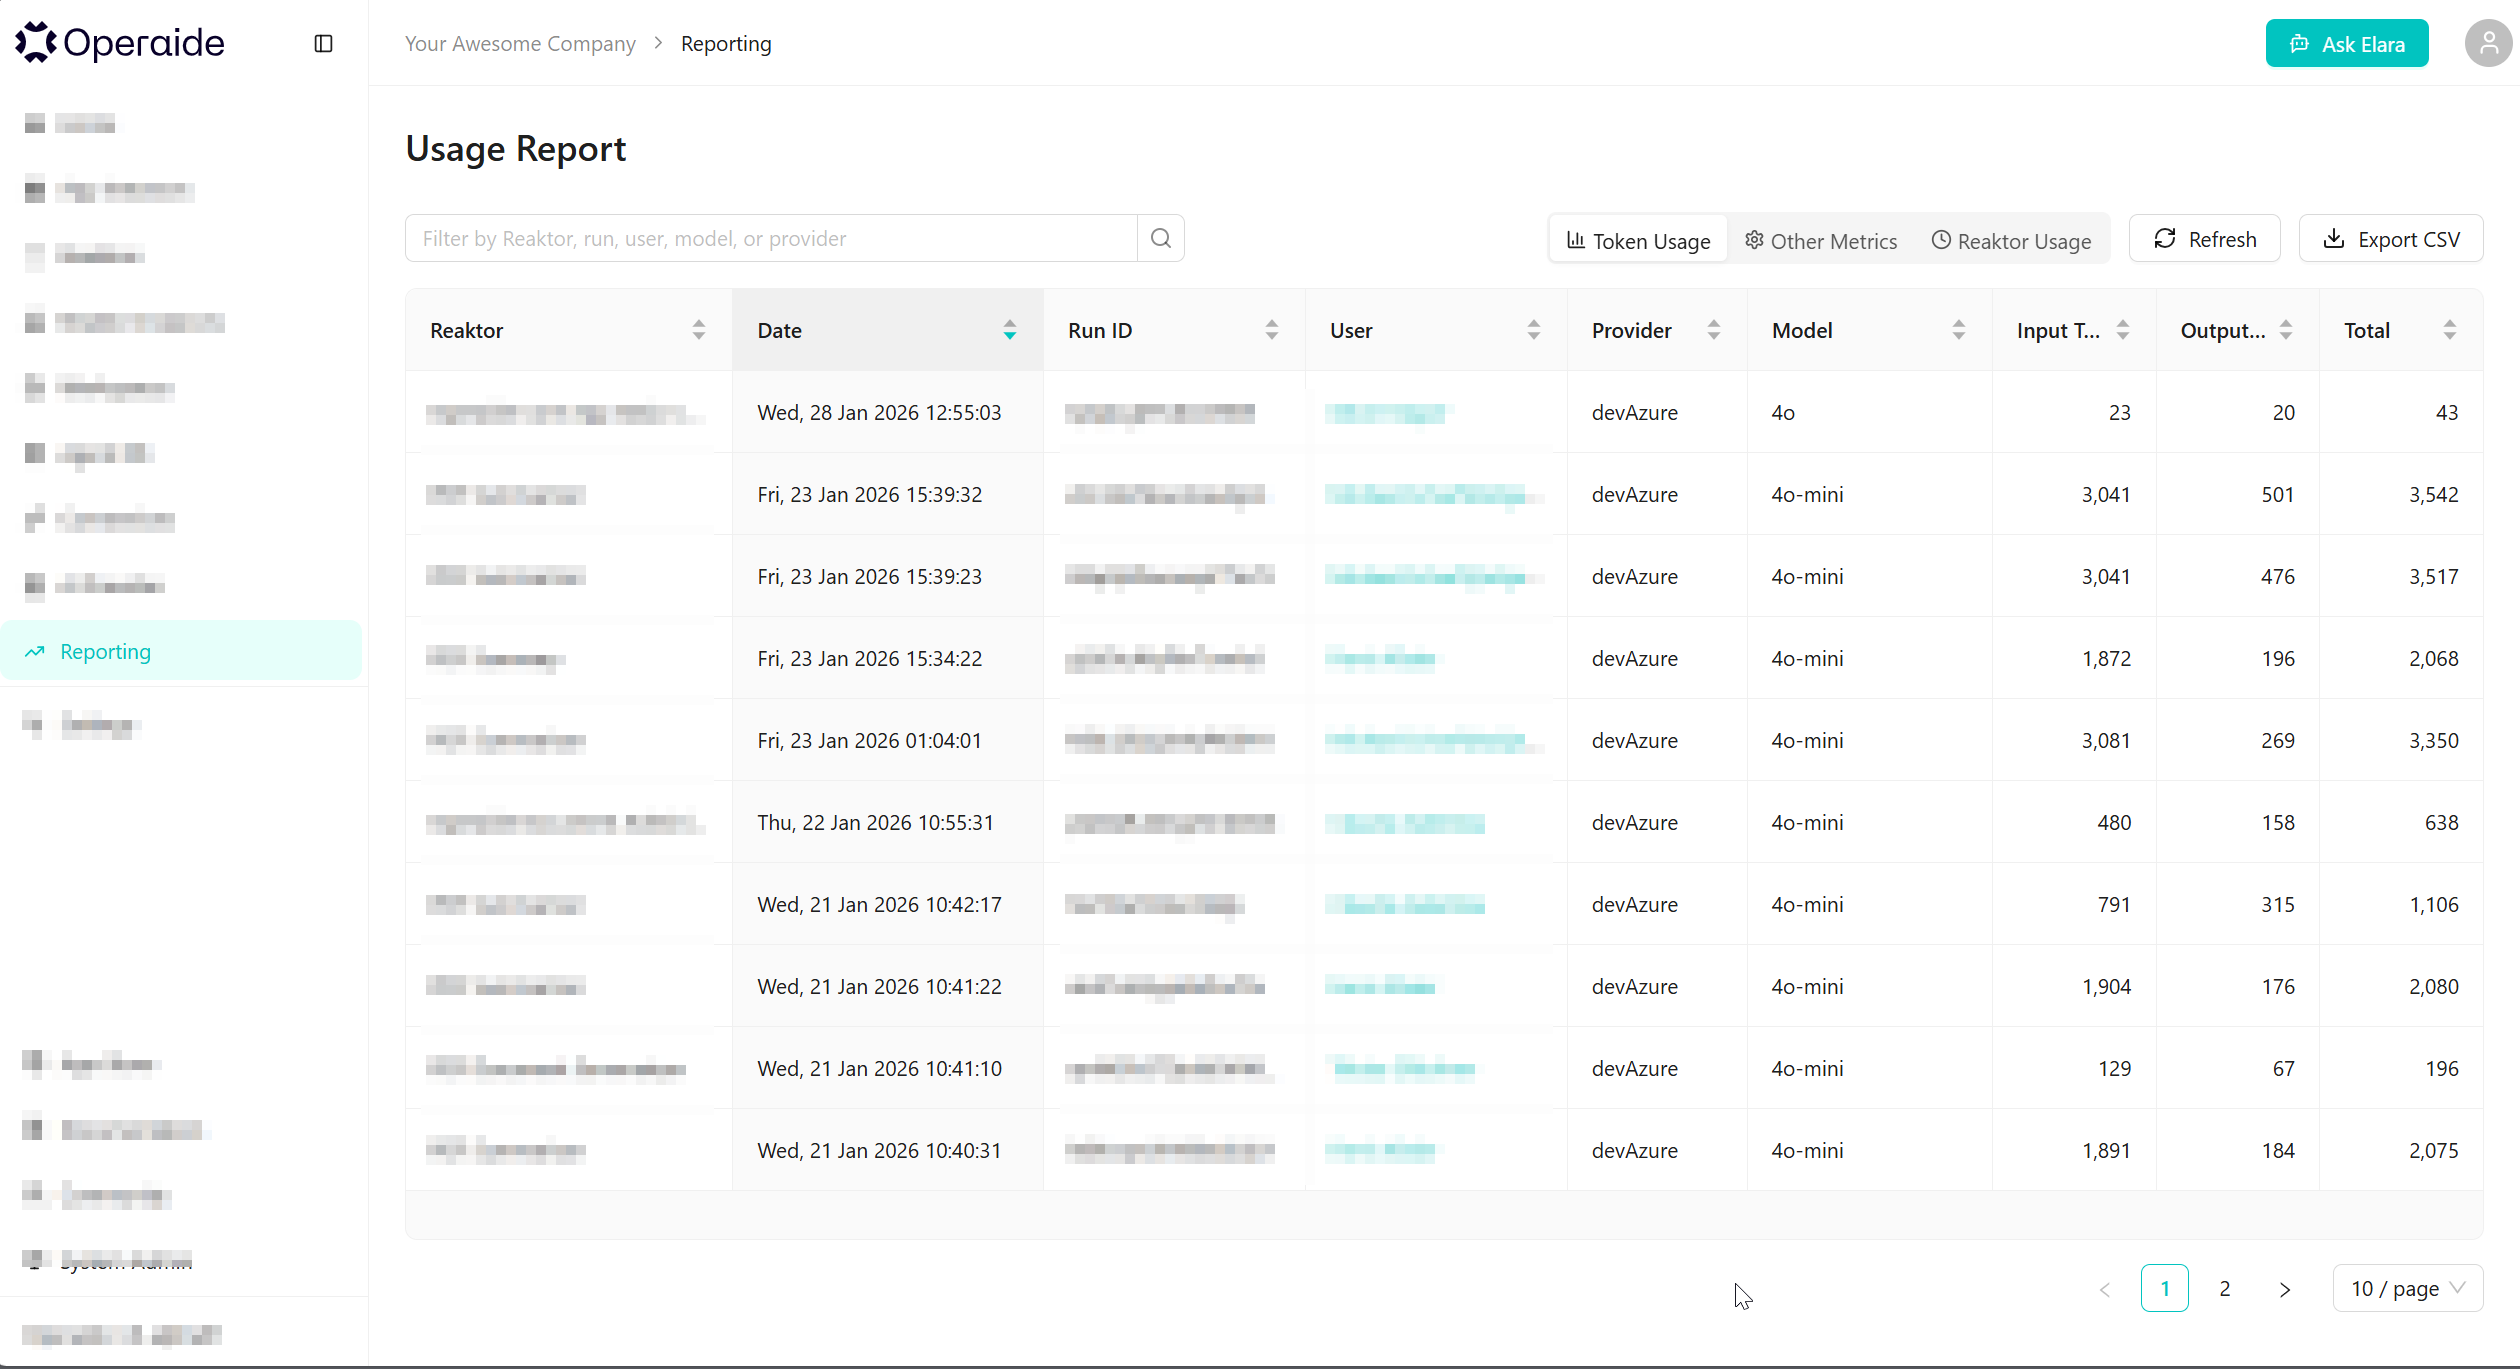
Navigate to Reporting in the left sidebar.
Overview
The Reporting dashboard displays a table with usage metrics per active Reaktor. You can switch between different views using the tabs at the top.
Report Tabs
Token Usage
Monitor AI token consumption across your Reaktors.
| Column | Description |
|---|---|
| Reaktor | Name of the active Reaktor |
| Total Tokens | Cumulative token usage |
| Input Tokens | Tokens used for prompts/inputs |
| Output Tokens | Tokens generated in responses |
Use this tab to:
- Track AI costs per Reaktor
- Identify high-usage workflows
- Plan capacity and budgets
Other Metrics
View resource utilization metrics beyond token usage.
| Metric | Description |
|---|---|
| Documents | Number of documents in connected databases |
| Embeddings | Vector embeddings stored |
| API Calls | External API invocations |
Use this tab to:
- Monitor data growth
- Track resource consumption
- Plan storage capacity
Reaktor Usage
Monitor Reaktor health and execution status.
| Column | Description |
|---|---|
| Reaktor | Name of the Reaktor |
| Executions | Total number of runs |
| Success Rate | Percentage of successful executions |
| Error Status | Current error state and recent failures |
Use this tab to:
- Identify failing Reaktors
- Monitor system health
- Troubleshoot issues
Debug Mode and Detail Traces
The detail trace described under The Two Recording Layers is gated by a per-deployment debug mode toggle. By default it is off. Turning it on causes the platform to start writing per-step traces for that deployment until you turn it off again.
There are two ways to control debug mode:
- From the admin UI, on the deployment's settings page.
- Programmatically via the REST API, which is the right approach for automated incident response and monitoring workflows:
PUT /api/v1/deployments/{id}/debug-mode— turn debug mode on or off for the specified deployment.DELETE /api/v1/deployments/{id}/logs— purge the existing detail traces for that deployment, useful at the end of a contained investigation.
The typical incident-response pattern is: enable debug mode, reproduce the error, collect the traces, disable debug mode, and (if appropriate) purge the traces when the investigation is complete.
A few things to keep in mind when working with debug mode:
- The detail trace is created going forward from the moment debug mode is enabled. It cannot reconstruct executions that already happened with debug mode off.
- The 30-day TTL applies regardless of whether debug mode is currently on. Older traces age out even if you re-enable debug mode later.
- Detail traces retain potentially sensitive workflow content, so the decision to enable debug mode for a production deployment is a deliberate one — especially for workflows that process personal data. See Compliance → Known Limits for the compliance framing.
The Audit Service Feed
In addition to keeping its own usage records locally, an Operaide instance can optionally report aggregated metrics to a central audit service. This is useful for cross-instance observability, billing reconciliation, and capacity planning across a fleet of Operaide deployments managed by the same operator.
The audit service feed has three properties worth knowing:
- It is a required platform component. Every Operaide deployment connects to the audit service (default URL:
https://audit.operaide.ai, configurable via theOPERAIDE_AUDITING_URLenvironment variable) and reports aggregated metrics every 24 hours. The audit service URL and authentication token are configured through environment variables and must be provided — the platform will not start without them. This is the one outbound connection the platform makes by default, beyond whatever AI providers and external integrations the operator configures through the connection system. The data transmitted is documented in the On-Prem Installation Guide → Network Requirements section. - It carries aggregated metrics, not raw events. The reporters compute totals per organization, per model, per day, and similar aggregations using database-level aggregation pipelines, then send only those aggregates. Prompts, workflow payloads, per-event user identities, and any other potentially sensitive content stay on the local instance. If you use the built-in mail integration, outbound emails are additionally routed through the audit service — see the On-Prem guide for details.
- It is not a SIEM replacement. If you need a per-event audit stream into a centralized security information and event management system, build that pipeline yourself from the local records or from CSV exports — the audit service feed is designed for capacity and billing observability, not for security event correlation.
Features
Refresh
Click the Refresh button to update the displayed data with the latest metrics.
CSV Export
Click the Export CSV button to download the current report data as a CSV file for:
- External analysis
- Record keeping
- Sharing with stakeholders
Best Practices
- Regular Monitoring: Check reports regularly to catch issues early
- Export Baselines: Export CSV reports periodically to track trends over time
- Set Alerts: Use error status monitoring to identify and resolve issues quickly
- Cost Management: Monitor token usage to optimize AI spending
Long-term Retention
Operaide keeps TokenUsage and ReaktorUsage entries persistently inside its own database — there is no automatic expiry on these records, so the operator decides how long they live. For most operational purposes (cost tracking, capacity planning, troubleshooting recent issues) this is enough on its own and no extra infrastructure is needed.
For compliance regimes that require long-term immutable audit archives — multi-year retention, write-once semantics, formal evidence of past activity — Operaide is not designed to be the system of record. The recommended pattern is:
- Use the CSV Export on the Reporting dashboard, or read directly from the local usage collections, to extract the data on a regular schedule.
- Pipe that data into the long-term storage your operator already maintains for compliance — for example, write-once object storage with object-lock semantics, an external SIEM, or a regulated archive service.
- Treat the local Operaide records as the working set, not the archive of record.
Detail traces (the ones gated by debug mode) age out after 30 days regardless of operator configuration, so anything you need to keep from a detail trace must be exported within that window. See Security and Privacy → Known Limits for the compliance context, and the related backlog story for the planned configurable detail-log TTL.