Deployment, Test and Debug
This chapter covers the full cycle from deploying your App to testing it and diagnosing problems. If you are deploying for the first time, the First App tutorial walks you through each step with screenshots.
Deploy Your App
Install Dependencies
Before deploying, make sure all dependencies are installed. You can either run npm install in the terminal or use the npm install preconfigured task from the Run button in the top bar.
Deploy (Development)
Click the Run button (play icon) in the Studio top bar to open the task menu. Two deployment options are available:
| Option | Command | Behaviour |
|---|---|---|
| Deploy to Operaide | npm run deploy | One-shot upload of your current code. Future edits require a new deployment. |
| Deploy to Operaide (Watch) | npm run deploy-watch | Watches your files and re-deploys automatically on every save. Ideal during development. |
Both options send your source files directly to the platform, which transpiles the TypeScript, validates the package, and immediately creates an App Instance for your organization. You can start testing right away — no manual installation step needed.
On subsequent deploys the platform updates the existing App Instance in place. In Watch mode, every file save triggers a re-deploy so you get a near-instant feedback loop.
The deploy is uploaded as a dev-channel build: your package.json version (0.6.0) becomes 0.6.0-dev in the platform UI, marked with a "DEV" tag. The file on disk is unchanged. See Dev and Stable Channels for the channel rules.
Publish (Distribution)
Once your App is fully tested, you publish it to the App Store so that other organizations or administrators can discover and install it:
npm publish
This packages your App as an npm tarball and uploads it to the built-in Operaide registry. The App then appears in the App-Store (bottom section of the left sidebar), where anyone with the right permissions can install it as a new App Instance.
npm publish rejects versions with a -dev pre-release identifier since that suffix is reserved for direct deploys. Use a plain version like 0.6.0 or a stable pre-release such as -rc.1 or -beta.2.
See App Store for registry configuration and the full publishing lifecycle.
Deploy is for development — it creates a private App Instance tied to your API key so you can iterate quickly. Publish is for distribution — it makes the App available in the App Store for others to install. A typical workflow is: deploy, test, fix, repeat — then publish when ready.
Navigate Your Deployed App
After a deploy, your App Instance appears in App Instances in the left sidebar. The platform organizes things across two levels — understanding this hierarchy helps you find the right place to configure, test, and debug.
App Instance
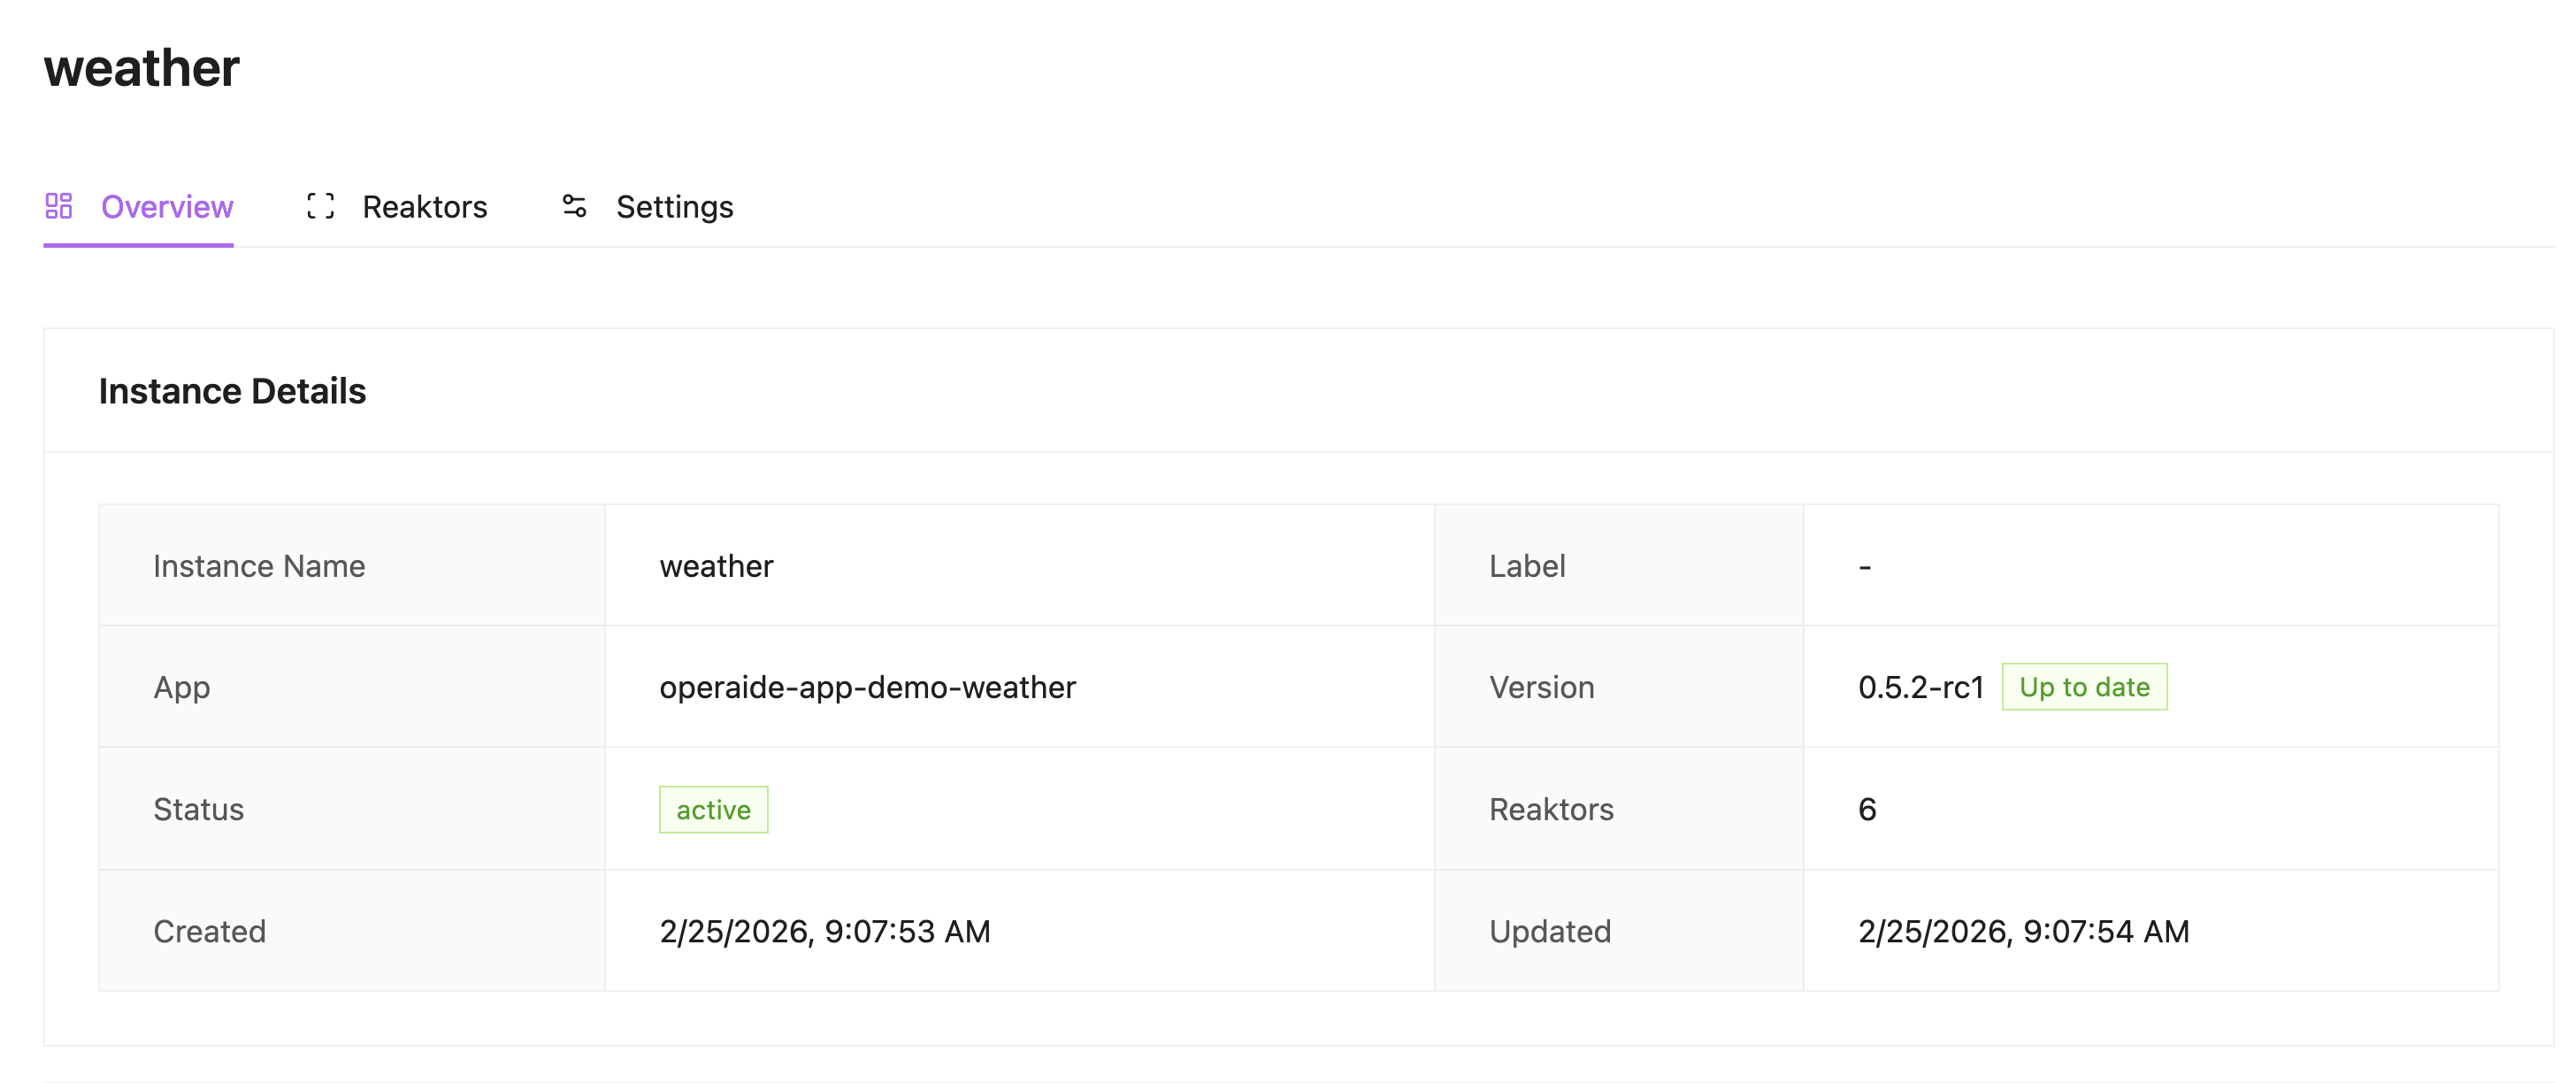
Click an instance to open its detail view with three tabs:
| Tab | What it shows |
|---|---|
| Overview | Status, version (with update notifications), API base path, links to the API Explorer (Swagger) and App UI |
| Reaktors | All Reaktor Deployments that belong to this App — click one to drill down |
| Settings | App-level configuration defined by registerAppSettings() |
Reaktor Deployment
Click a Reaktor in the Reaktors tab (or navigate via Reaktor Instances in the sidebar) to open the Reaktor Deployment detail. This view has seven tabs:
| Tab | Purpose |
|---|---|
| Overview | Status, description, and quick links |
| Metrics | Request counts and performance data |
| API | OpenAPI spec and Swagger UI link for this Reaktor |
| Settings | Per-Reaktor settings defined via aktorSetting() |
| Execution | Run the Reaktor with test inputs directly in the browser |
| Diagram | Reaktor diagram visualizing the Aktor graph |
| Logs | Execution traces and error details |
Test Your App
Operaide offers several ways to test a deployed App, depending on the type of Reaktor and how you want to interact with it.
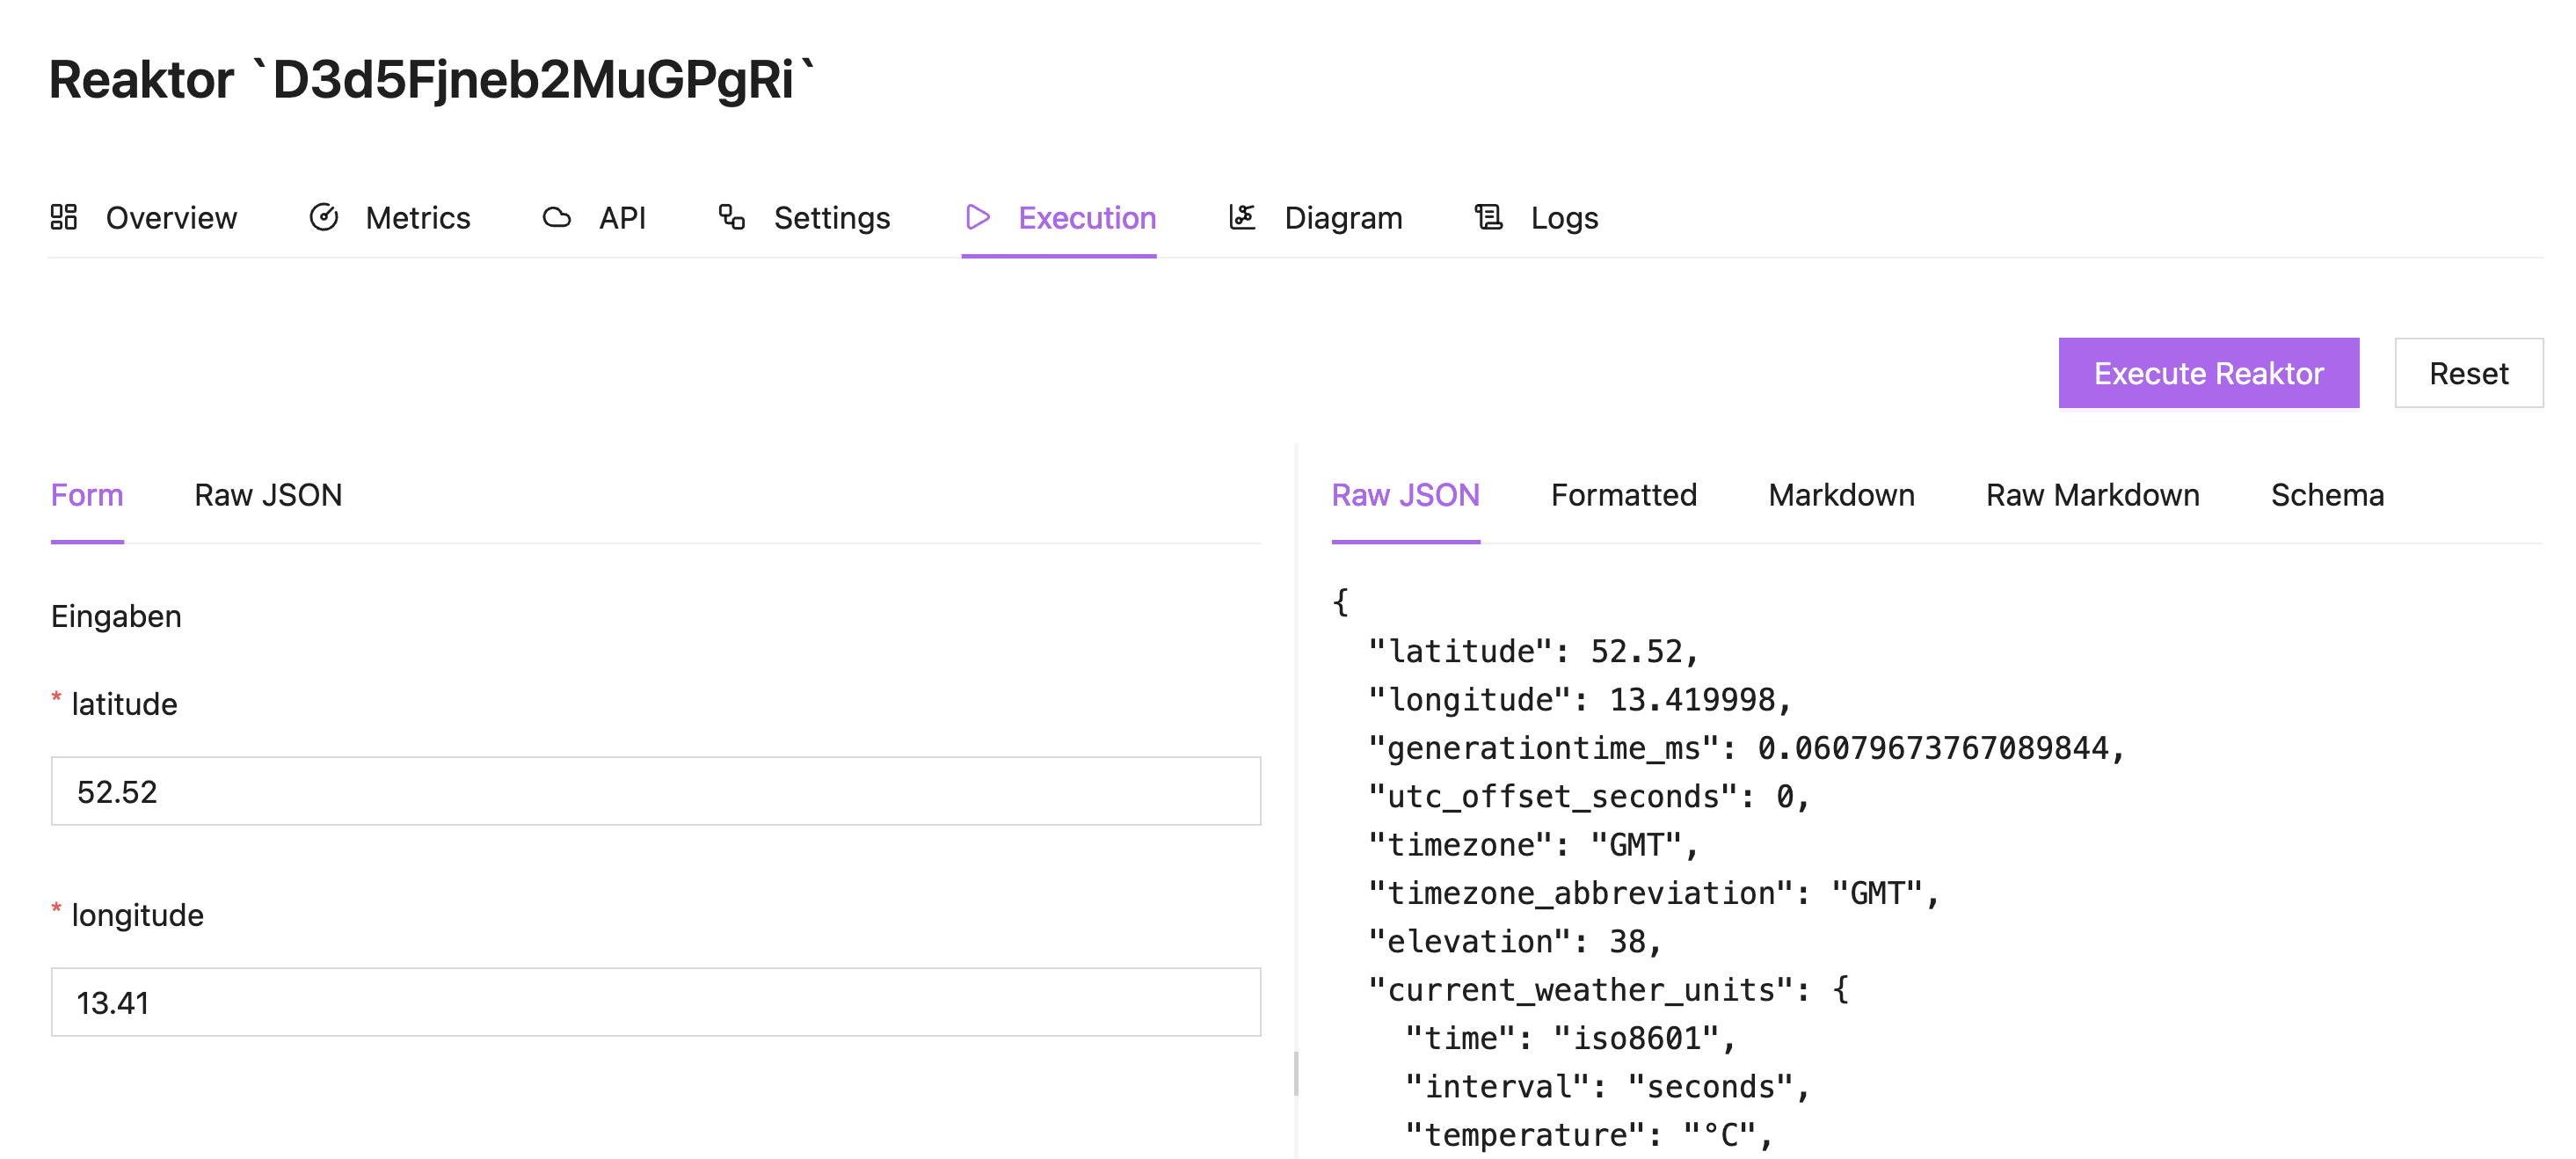
Execution Tab
The most direct way to test. Open a Reaktor Deployment and go to the Execution tab. You can supply input values matching your Reaktor's inputSchema and run it. The result is displayed inline.
API Explorer (Swagger UI)
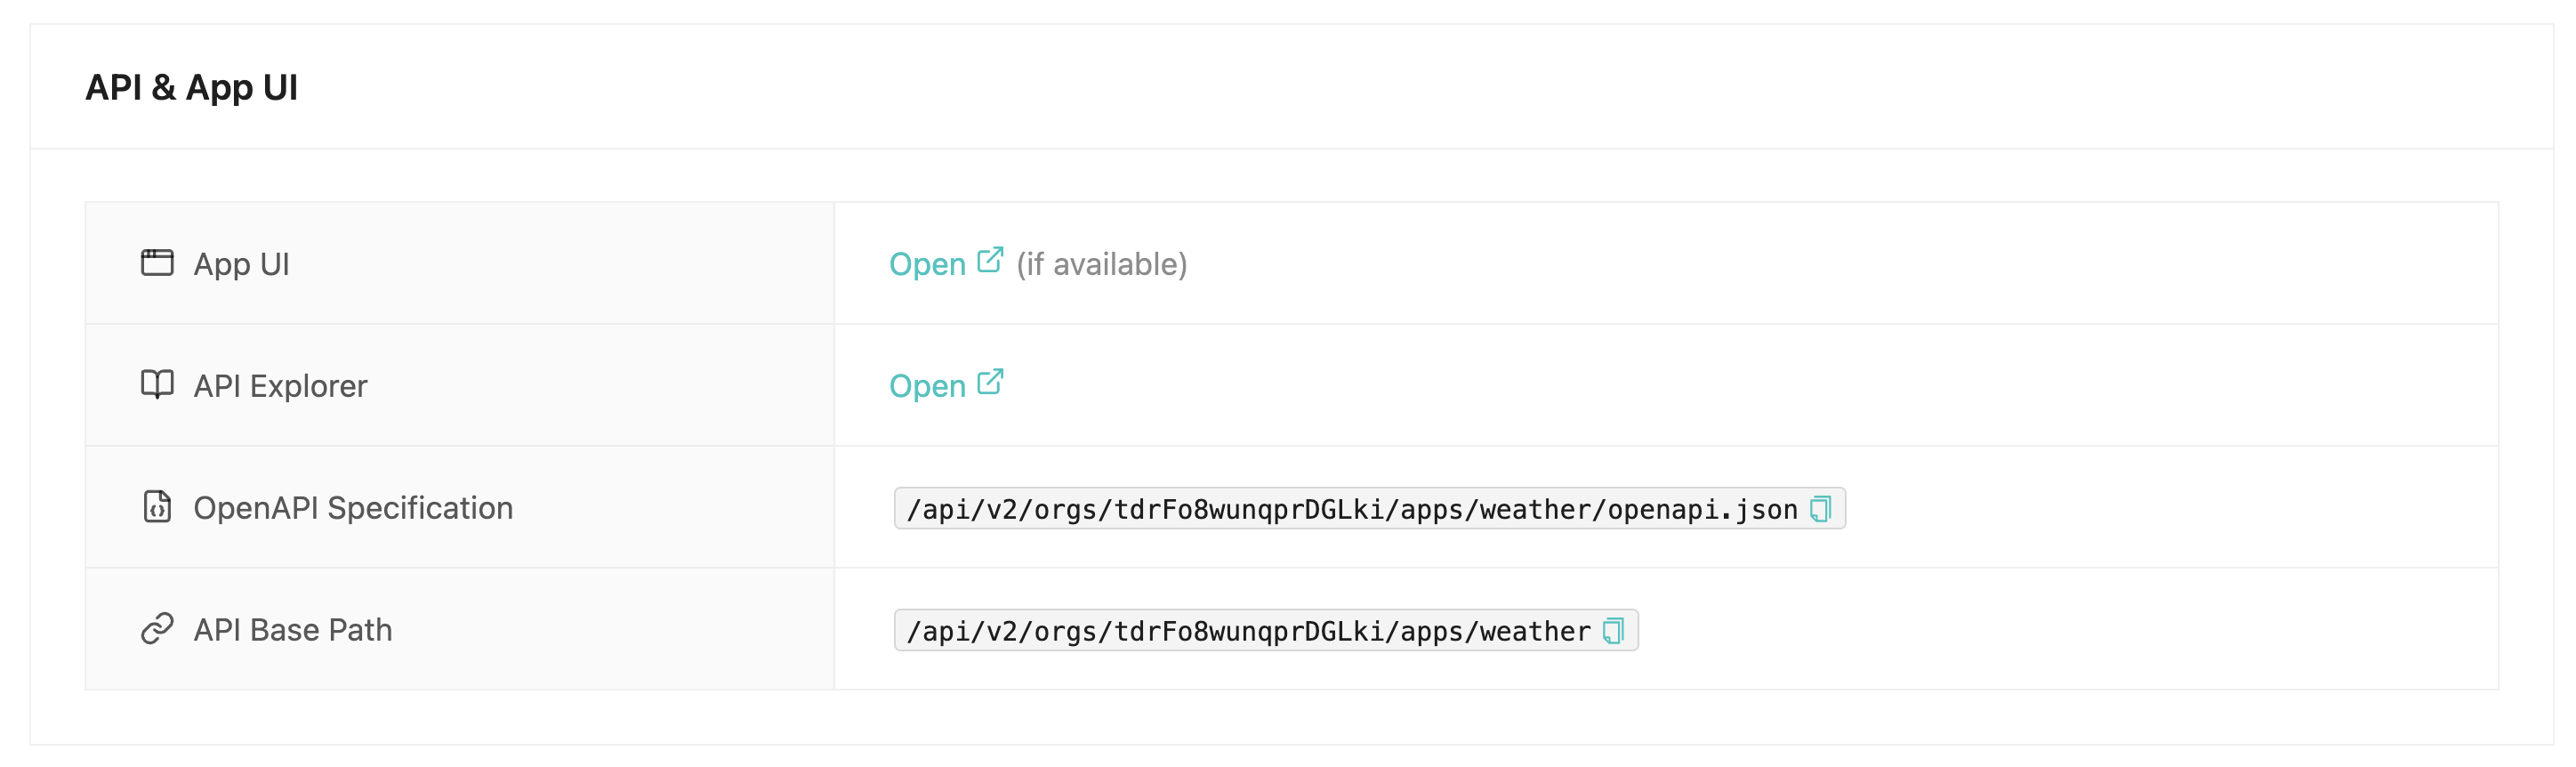
Every Reaktor Deployment exposes an auto-generated OpenAPI specification. The App Instance Overview tab shows a direct link to the Swagger UI, where you can:
- Browse the full API schema
- Send test requests with authentication
- Inspect response payloads and status codes
Authenticate with your API key via the X-API-KEY header. You can find or create API keys in Settings > API Keys.
App UI
If your App includes a custom web frontend in its public/ directory, the App Instance Overview tab shows an App UI link. This serves your static HTML/JS/CSS directly from the platform, authenticated via login token.
Elara Chat
For chat-compatible Reaktors (registered via registerChatReaktorDefinition), Elara provides a full conversational testing interface. Your Reaktor appears in the model selector alongside base AI models — no extra configuration needed.
REST API
You can test any Reaktor from external tools (curl, Postman, scripts) using the REST endpoint:
POST /api/v2/orgs/{orgId}/apps/{instanceName}/reaktors/{reaktorName}
Include your API key in the X-API-KEY header. The exact URL is shown in the App Instance Overview tab under "API Base Path".
Debug Your App
Logs Tab
The Logs tab on a Reaktor Deployment shows stored log entries with filtering, search, and export. Enable Debug Mode to also capture debug and info level entries. See Logging and Debugging for the full feature reference.
Run Tracing
Run Tracing records the full state at each Aktor step, giving you visibility into intermediate values flowing through your Aktor graph. This is especially useful for debugging multi-step pipelines where the final output looks wrong but you need to find where things went off track.
Run Tracing must be enabled by an administrator (it requires the permToUseReaktorRunTracing permission). Large payloads are automatically truncated to keep trace data manageable.
Once a run is traced, you can step through it on the diagram. See Reaktor Trace Walk for stepping, playback, and following a live run.
Common Issues
| Symptom | Likely cause | What to do |
|---|---|---|
| Deployment fails with TypeScript errors | Syntax or type errors in your code | Run Check: TypeScript from the Run menu to see the full error output |
| Deployment fails with missing module | A dependency is not installed or not in the sandbox allowlist | Run npm install; check that the module is in the allowed list |
| Reaktor returns an error at runtime | Bug in Aktor logic | Open the Logs tab on the Reaktor Deployment to inspect the stack trace |
| API returns 401 or 403 | Invalid or missing API key, or insufficient permissions | Verify your API key in Settings > API Keys; check that the key's organization matches the App Instance |
| Watch mode stops syncing | The background process may have crashed | Stop the task and re-run Deploy to Operaide (Watch) |
Download Your App
In the App Instances, each installed App offers three actions:
- Uninstall — removes the App Instance and all its Reaktor Deployments
- Download — exports a
.tgzarchive of the App source code - Open in Studio — opens the App in a new Studio workspace for editing
Preconfigured Tasks
Operaide Studio ships with preconfigured tasks accessible via the Run button in the top bar. These are defined in .theia/tasks.json inside your workspace.
| Task | Command | Description |
|---|---|---|
| Deploy to Operaide | npm run deploy | One-time deployment to the platform |
| Deploy to Operaide (Watch) | npm run deploy-watch | Continuous deployment — re-deploys on every file change |
| npm install | npm install | Install all dependencies |
| Check All | npm run check | Run all checks (ESLint, Prettier, TypeScript) |
| Fix All | npm run fix | Auto-fix linting and formatting issues |
| Check: ESLint | npm run check:eslint | Run ESLint only |
| Check: Prettier | npm run check:prettier | Run Prettier formatting check only |
| Check: TypeScript | npm run check:tsc | Run TypeScript type checking only |